Industrial CT Scanning: Defining Porosity of 3D Porous Structures for Medical Implants using Advanced Metrology Methods

With the advent of new ways of creating medical implants that promote bone ingrowth, an updated method of evaluating their effectiveness should be employed. 3D Printed Additive manufacturing and other creative manufacturing techniques have been developed to create porous structures that promote bone ingrowth. Traditionally, the effectiveness of these structures is tested by taking 2D cross sections of harvested implants and applying calculations to define pore size and interconnectivity. In this way, researchers can test and compare the Osteoconduction ability of the new structure.
Basically, they take the 2D cross sections and determine how far bone has grown into the spaces shown. While this gives a good indicator of growth, it lacks the more full 3D view of bone ingrowth. The 2D cross section or sections only show discrete areas of the implant and do not evaluate the whole structure. A 3D method that considers all of the structures would improve the overall characterization.
The 3D capabilities of our in house Industrial CT Scanning are a well-made match to the 3D printed custom implants that are becoming available. Our in house Nikon 225kV MCT scanners offer an avenue to obtain ISO17025 certified data to use for the 3D evaluation of this type of testing. 3D Engineering Solutions has our MCT equipment listed on our ISO17025 scope of accreditation. We have developed measurement uncertainties for this equipment and use it for dimensional inspections for all of industry.
A 3D CT scan provides a full view of the part being scanned inside and out. Not only do we see the insides of the components but inside of the material itself where there might be porosity or inclusions. These defects can be extracted and quantified as well as easily visually seen. Traditional methods required the destruction of the sample to gain this information. Destroying the sample also gives the possibility that a mistake could be made during sample mounting and preparation that ruins the test. Below is a generic industrial plastic component that has been CT scanned. All 4 images are produced from the CT scan and VG Studio Max software produced by Volume Graphics. Figure 1 shows a 3D rendering of the raw CT data. This is not a model of the part but a representation of the voxel data. Figure 2 shows a graphical view of the pores inside the plastic structure. The size of each pore is colorized by size and the outside surfaces of the CT scan have been made transparent for easy visualization. From this image we can see the general location of groups of pores which can help in troubleshooting any issues in the fabrication process. This plastic part was created through injection molding. However, the same troubleshooting help and visualization would apply to 3D printed structures to determine delaminations, porosity, etc. The next two images (Figures 3 and 4) show a virtual 2D cross section of the part. This type of view can be used to replace traditional mounting, sectioning and polishing that are currently done. And this could be used for process validation when moving from the older style 2D sections to fuller 3D information. The same information is available in these virtual 2D sections and the same calculations can apply to the dataset.
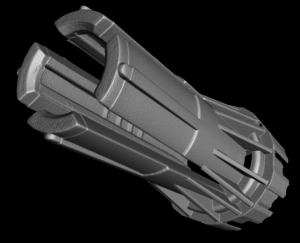
Figure 1: 3D View of CT Voxel Data
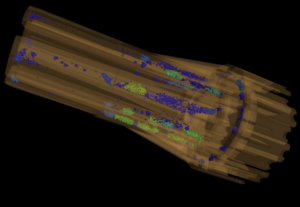
Figure 2: View of CT Data with Surface Hidden
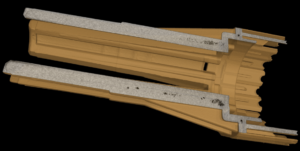
Figure 3: Cross Section View of CT Voxel Data
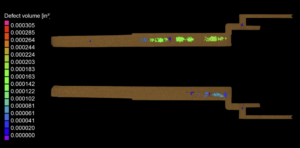
Figure 4: Color Mapped View of CT Voxel Data
The beauty of using this non-destructive inspection method for non-destructive testing is in the ability to take unlimited number of 2D sections as needed without damaging the original scanned part.
But even more valuable is the ability to analyze the data in 3D. Using VG Studio Max we have the ability to take the inverse shape of a porous medical implant structure and export it to other metrology software for analysis. Typically this is done by converting the voxel data set into an STL file. This inverse shape would be effectively the “air space” through the part. This would represent the porosity of the structure and the level of interconnectivity. Inside Innovmetrics PolyWorks software for example, we can perform a thickness analysis of the represented “air space”. The thickness analysis will give a 3D visualization of the thickness of each air passage by using a colorized map. Beyond this, we can extract statistical properties of the air passages such as the measured mean thickness, standard deviation and RMS values. The smallest passage may also correlate well to the percolation diameter of the structure.
Not only is the original sample preserved in this type of evaluation, but a much larger amount of rich information can be extracted. And the data is easily stored for future retrieval and comparison to later samples. We have customers who have asked us for data from projects over 5 years old! Generally our customers want to compare first article pieces to ones fabricated months or years later. This gives them a sense of how associated tooling or processes are changing with time. Our policy is to keep data indefinitely unless asked to remove it.
At 3D Engineering Solutions, we are often approached with difficult problems to solve. Our degreed engineering staff enjoy these type of projects and have added great value to our customers over the years. If you have a problem that could be helped by having more rich three dimensional data, please contact us.
Leave a Reply
Want to join the discussion?Feel free to contribute!