Common Non-Contact Measurement Devices and Methods
Non-contact or touchless dimensional measurement devices are the modern new comer to an array of contact devices that have been traditionally used. Contact devices are discussed in this link on Common Contact Measurement Devices. All of the non-contact devices generate a point cloud or voxel data set as their most raw form of data. The exception is the optical comparator which has been around since the late 1920s. It does not expressly produce digital data, but some of the variant equipment that evolved from this equipment does.
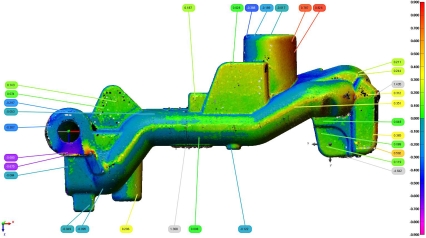
Non-contact scanners fall into a few general categories: Optical Comparator, Vision Systems, CT Scanning, Photogrammetry, Long Range, Laser, Structured Light, Laser Radar and CFS. There may be other categories; however, these constitute the lion share of 3 dimensional technologies that are in common use (or soon to be common use). All produce point clouds, voxel data sets or/and STLs (a polygonal model based on millions of tiny triangles). The image below shows 3 images of a fishing lure STL.
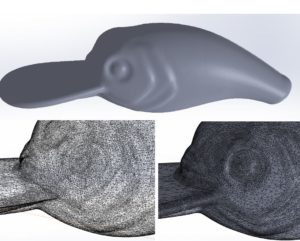
FIGURE 1: Fishing Lure STL Images
Their primary advantages lie in the vast amount of data they are able to collect in a short time and their touchless method in collecting data. They are generally less accurate than contact measurement devices but not by much. Because they collect so much of the surface compared to contact measurement methods, they are able to capture the very complex surfaces that are now build into products (turbine blades, medical instruments, automobiles).
This is meant to be a general overview to give you an idea of how a service provider may go about choosing which equipment to use for your project. Most are not fortunate to have as many different types of equipment, but those that do are able to service their customers more efficiently and with equipment best suited for any particular application. 3D Engineering Solutions has all of these types of devices (except Laser Radar – it’s on my wish list).
Optical Comparator
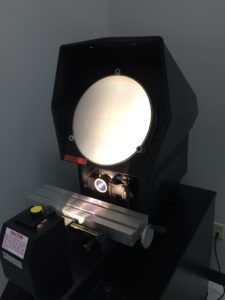
FIGURE 2: Optical Comparator
Although the optical comparator doesn’t yield a point cloud as most of the other non-contact technologies do, it has been a tried and true method for gathering precise information on intricate parts. It is also called by the name ‘shadow graph’ which descriptively tells how it functions. A light is shined in front of or behind an object and that light is sent through a magnifying lens to a screen. The black and white image created by the shadows can then be measured by moving the part on its stage through various spindles. The spindles move the stage which is attached to 1 dimensional measurement devices and are either read out directly on Vernier calipers or indirectly through encoders. Transparencies can be placed on the devices screen. These correspond to print specs and those dimensions and profiles can be quickly tested against those specs. The closest modern version to a comparator is the vision system discussed next. Although the magnification principle involved here is utilized in industrial CT scanning as described further below. This is best used for seeing the profiles of small tightly controlled features like threads. The accuracy can be very tight depending on the unit and magnification used.
Vision System
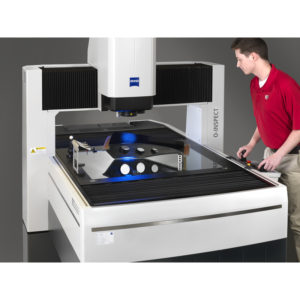
FIGURE 3: Vision System
Vision systems come in many varieties but generally operate on the same principle. Much like optical comparators, they apply lighting to an object and creatively magnify the object so that clear edges and surfaces are seen. That data can be digitized into a point cloud that represents those edges and surfaces. Many have a series of optics that provide different levels of optical magnification. This is especially useful for very small parts that are difficult to measure with other tools. By the same token, if there is a small amount of dirt on the part that will be also magnified and will add error to the data. The systems do not know if the dirt is an actual part of the object or not. Our Zeiss system actually has 3 different methods to collect data (probing, vision and CFS – Multi-Sensor Vision System). This makes it a versatile tool for complex projects. Many systems are sold with only the vision capability and are great for manufacturing environments where only one type of measurement is needed on many parts. The software that come with these systems have complex algorithms for discounting areas where dirt or debris exists on the part. These systems are ideally suited for flat 2 dimensional parts. Some even boast of fully characterizing (measuring all the print dimensions) such parts in a few seconds each! These systems can also be used for judging 3D distances as they can use their autofocus ability to establish heights. Their accuracy is dependent upon their magnification ranges, the flatness or low distortion of the optical fields (this is a key parameter for these devices) and the XY positioning equipment they are attached to (if so equipped). Our vision system is attached as part of a multi-sensor CMM and has measurement uncertainties of around 1.2 microns to around 30 microns depending upon which magnification is used. Our system also has the optional feature of an integrated rotational stage that allows rotation of the part to collect data on other sides while maintaining the correct alignment and coordinate system.
It is up to the user to decide how dense the data needs to be on any particular edge that the vision system sees. It is as simple as indicating ‘x’ thousand points inside the creation of that features (more data is generally better). Since the modern CMM version of these systems are programmable, many parts can be quickly measured once a CMM program has been set up.
These systems are ideally suited for high accuracy inspection work.
Industrial CT
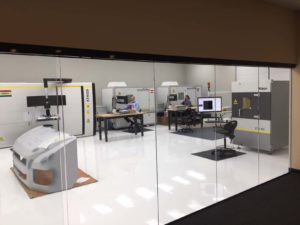
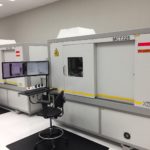
FIGURE 4: Industrial CT Scanners
CT scanners have made great strides since their inception and original use in medical applications. A medical CT scanner may have ranges of 60-80kV. Industrial CT scanners generally range from 160kV to 600kV. Since CT machines are often tasked with measuring dense metallic parts, the higher power is needed. The modern variety also has a much higher resolution than medical CT scans. Industrial CT scanners of today can include metrology grade encoders, temperature controlled chambers, massive and stable manipulators/stages and laser calibrated source to detector distances. They are no longer just for generating nice pictures of the inside of something.
Although specialty units can be built that are more powerful (I have heard of 10 MeV machines), they are generally, unique one of a kind machines, that have no OEM support when trouble happens. In our service business, we choose OEM equipment from stable, reliable and well known companies to ensure our equipment up time is high to service our customers. We have 4 CT scanners purchased from Nikon and if they go down, we have next day support! That is actually faster than some of our less costly equipment — Outstanding.
Each CT scanner is a digital x-ray machine capable of creating thousands of x-rays of an object and then reconstructing them into a 3D volume called a voxel data set. Unlike a point in a point cloud, a voxel is an actual cube volume that represents a size, position and relative density (ability to abate x-rays). A voxel data set contains millions of voxels. This is extremely useful in finding defects inside of materials or in hidden channels or other obstructed areas that other methods cannot see. Other light based methods require that the camera see the light source in order to capture the data (have a line of sight). While technically this is true for CT, since x-rays travel through objects that line of sight restriction is removed. I say technically true because x-rays are photons = light. This technology is the current pinnacle of dimensional data collection technology for hard to reach areas. Because of the rise of metrology grade CT scanners and the ability of CT to get past line of sight issues, quality managers are seeking data on their products from CT to be used in first article inspections.
Along with the advantage of being able to see through parts and assemblies, they have a disadvantage of sometimes having noisy data. The x-rays can bounce around and cause stray data (similar phenomena as seen in other types of scanners). If the parts are very thick or have a high density, this effect is increased as more power is needed to penetrate. To mitigate some of the noise that is seen in panel based CT scans (a panel is just an x-ray sensitive screen similar to your monitor), LDA or CLDA (Curved Linear Diode Array) detectors are used. These detectors only take a single line of data at a time. So if the x-rays are being scattered or reflected, that light is most likely to fall above or below the line of data instead of into another line of data. For a similar location in a panel scan, sending a stray x-ray above or below that line would cause noise for other lines in the scan. While LDA/CLDA data is less noisy, they are much slower as well. For comparison consider our 2,000 line by 2,000 column x-ray panels relative to just a single line of data. I have to scan 2,000 times to get what I could from one panel scan!
Data accuracy from CT scans depends upon the effective voxel size. The smaller the part you have to measure, the more accurate the data you will see (up to a point). This is due to the principal of magnification. We measurement uncertainties for our metrology grade scanners of around 9-10 microns. Scanning time can be from 3 minutes to 180 hours! The equipment is quite expensive and requires a well trained staff. Our staff at 3D Engineering solutions is cross trained on each technology that we own and meets that requirement.
Photogrammetry
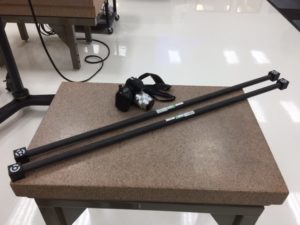
FIGURE 5: Photogrammetry Kit. High end digital camera with fixed focal length lens and scale bars.
Photogrammetry is accomplished using digital camera(s). Images are taken from multiple angles of an object and each pixel is basically stitched together to form a point cloud based on the relative positions of the pixels in related pictures. These cameras can be very high end cameras with expensive fixed focal length lenses to cell phone cameras. Software is used to combine the images and generate a point cloud. The better cameras/lenses produce more accurate images. Higher resolution cameras can produce higher resolution images (more points). Using an array of cameras is useful for capturing people who have a tendency to move or just to capture the data more quickly. Adding scale bars to the scene before it is photographed allows calibration of the scale of the point cloud. A popular thing to do is to use a drone camera to capture the data of large objects to create a point cloud.
An advantage of this method is that you often have color information from the images that can be used as a ‘texture’ for the point cloud or an STL file. Relatively speaking, the data collected is of low resolution and accuracy. However, for large structures (buildings, deep pits, large piles of minerals or hills for example) this is not an issue. For higher accuracy and resolution, you would want a long range laser scanner.
Long Range
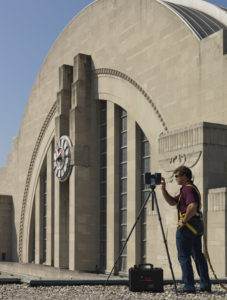
FIGURE 6: Long Range Scanner Onsite
Long range laser scanners as the name implies collect point clouds from great distances (generally called Lidar). Our customers for this technology are generally in the AEC market (Architectural, Civil Engineering and Construction). Although we have used long range scanning for many other customers. The most accurate ones are limited to a radial range of about 350m (1/5 mile) to 1,000m (5/8 mile) in one set up (you combine multiple scans to get larger areas). The fastest can scan at up to 1 million points per second in the mm range of accuracy. Others collect less data and are in the cm range of accuracy. These scanners can be configured and mounted on cars/trucks or in aircraft. The best accuracy is found in the terrestrial based scanners though. Each scanner scans in a spherical pattern. So points at the extreme range are more sparse than those close to the scanner location. Figure 6.1 shows this concept. The point cloud is much denser near the tripod location (black oval area near center of the image) and becomes less dense as you move away from this (best seen in left side of the image).
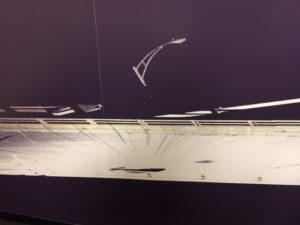
FIGURE 6.1: Image of Long Range Point Cloud of a Bridge Section
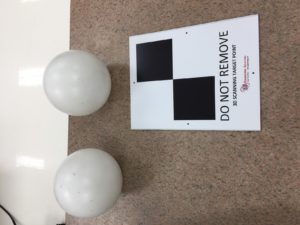
FIGURE 6.2: Image of Spherical and Flat Lidar Targets
Each scan is connected to other scans in a few ways through software. Targets (FIGURE 6.2) can be used and generally are 2D targets or 3D spheres. The idea is to have multiple targets (ideally more than 3) in each scan overlap with the next scan. This helps establish a common coordinate system. Because the scan data sets are large (have a very high number of points), it is wise to have a stronger computer to help with processing. The data form a long range scan tends to be more ‘noisy’ than short range laser scanners. So if you were to look at a flat surface scanned with a long range scanner and compare it to a short range laser scanner, you would notice a larger amount of scattering from that plane.
Laser
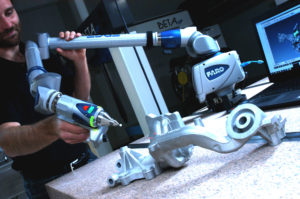
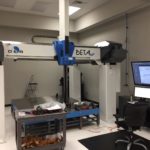
FIGURE 7: Short Range Laser Scanner on PCMM
Short range laser scanners use non-visible light and a camera to create point clouds. These are typically line scanners (they scan in lines of many individual points). The laser is at an angle to the camera and the laser is divided into many spots that scan at high rates to create a point cloud. The number and rates vary, but some typical numbers are 2,000 points per line scan x 280 frames/second scanning frequency. More points per second are not necessarily better – the overall accuracy is. Sometimes having so much data (560k points per second in my example) is a hindrance. The point cloud becomes too dense and the data more difficult to process efficiently. However, this can be mitigated by covering a larger area in the same time or reducing the amount of points collected in the software. The accuracy of the scanner itself is generally in the 0.001” range. However, you must couple that with the device that is holding the scanner. In portable coordinate measuring machines (PCMM), a human operated measurement arm has the scanner mounted to it. These arms have multiple joints which each have glass encoders used to calculate the angles to determine the point locations. There are typically 6-7 encoders used for this. A fixed CMM (not-easily movable) typically only employs 3 encoders. So the amount of error from a laser attached to a fixed CMM will generally be much lower. Both fixed and portable CMM mounted lasers have an issue with resolution that may or may not pose an issue. As you move the scanner closer to the surface the points become closer together and vice versa. So surfaces with contours will have non-uniform point spacing. If you rotate the scanner while scanning, you will also get a variable ‘fan’ pattern to the scan. Not an issue for accuracy but more of one for point to point spacing (resolution). The speed at which you move these line scanners, also determines the point to point spacing. Portable CMM laser scanners have a lower accuracy than fixed CMM based laser scanners.
There are also laser scanners that use other means to align the point cloud data. One uses targets mounted on the hand held laser that are read by a sensor bar set at a distance. These generally will have lower ultimate accuracies than the arm based lasers and the fixed based CMM lasers but offer greater flexibility and freedom while collecting the data.
Scanning area is another parameter to be considered. Fixed base CMMs are exactly limited in their scanning volumes to a volume a little less than their measurement volumes. Arm based PCMMs can scan an unlimited volume but the error in scanning increases with each ‘leap frog’ (movement of the portable arm between measurements for large volumes) that is required. The tethered hand held laser scanners that employ a sensor bar set at a distance are also limited but can be made to scan much larger areas (these must have line of sight to their sensor bars). The one that is right for your project depends upon your exact requirements. Our engineers here are expert at determining the right equipment for the job.
Structured Light
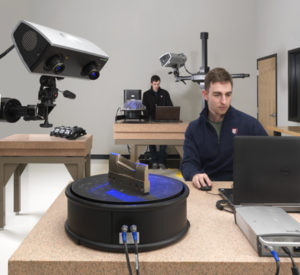
FIGURE 8: Blue Light Structured Light Scanner
This Structured Light method of touchless data collection employs a projected light pattern that is read by a camera. The pattern typically ranges from vertical and horizontal stripes to a randomized pattern that looks like static from the old televisions. These patterns are either static images or are moved / varied throughout the image and are projected onto the surfaces being measured. Each camera image taken is then interpreted and a point cloud subset is created from them. Each subset is then aligned to the other subsets through one of a few different ways.
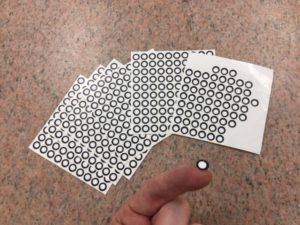
FIGURE 8.1: Sticker Targets
Some systems automatically align scans to each other using the geometry (geometry match) of the part to help align. Basically, they try to best fit the new scan data to the existing one and then iterate the alignment until a best fit is achieved. Some are aided in this by the user picking corresponding points on the computer between the new data set and the existing scan data. The other primary way is to use coded or un-coded targets to align data. The un-coded targets are small stickers that usually have a white center and black border (FIGURE 8.1). The system knows the size of these and can calculate the centers to establish points to base the alignment on. Some software will allow the area under the target stickers to be filled in with data in an automatic fashion during post processing by extrapolating the data around the sticker (usually not a bad assumption). Some projects however cannot allow contact with the sticker targets and the geometry match method must be used.
If large areas are being scanned, coded (numbered) targets can be used to help set up the framework of un-coded targets. The system that we have uses photogrammetry to accomplish this. A high end camera with a very nice fixed focal length lens is combined with measurement artifacts that are placed in the scene for scale. All of the coded and uncoded targets are placed around the large object (a car for example) and images are taken of them using the camera. That data is downloaded into the software which sets up the framework to taken the smaller scan sections. The coded targets can then be removed and images taken of the scene that is full of uncoded targets. The error of this set up is approximately equal to the photogrammetry error which is for large objects relatively small (thousandths of an inch). This form of photogrammetry is much more accurate than the more general form described above.
You want at least 3 (and preferably more) uncoded targets in each image that is taken of an object. These minimum 3 targets are then reduced to single 3D points in space by the software. Since three 3D points are sufficient to establish a coordinate system, the scans can be aligned to each other. This is the same principle that is seen when tooling balls are used in manufacturing fixtures. The better fixtures have 3 tooling balls that establish the coordinate system. Having more uncoded targets in an image is useful and allows for a better averaging/best fitting of the data sets. It is also a good practice in case some of these stickers come off of the object being measured. They are just stickers and sometimes they don’t stick well (especially if the surface is oily or dirty).
The raw data collected by Structured Light Systems is a point cloud. Some systems process this data internally and will only allow you to extract an STL. They do some internal averaging to make the surface appear smoother than the raw data presents. Others give you the raw point cloud (or only slightly modified one) or give it to you as an option. Be careful. Some systems create the STL automatically and if you pick to export a ‘point cloud’ it does not give you the raw point cloud used to create the STL but rather create a point cloud based on the corners of each triangle of the STL. These are not the same. Most software replaces the point cloud points with other ‘averaged’ points to be used for STL generation. This does add some error but makes the point cloud smoother and averages out the typical ‘fuzz’ seen in raw point clouds.
Because the data is generated using camera images, the resolutions (points per square inch) is very dense and regular compared to a laser scan for example. This data is best used for intricate reverse engineering projects because of this regularity of the data. For a while Structured Light OEMs were trying to outdo themselves with higher and higher megapixel cameras for increased resolution. Most of the time these extremely high megapixel counts are not needed and are a calculation hindrance and corresponding the datasets become so heavy that only the strongest of computers will allow easy processing of the data.
White light scanning and blue light scanning structured light systems are the most prevalent types. Some others integrate color data to show texture and one was actually created for a short time based on laser data instead of white or blue light. Those who use white light scanning, will typically try to remove all ambient lighting during scanning. This helps preserve the contrast in the image. Some go as far as painting their walls black to prevent stray light intrusion on the scanning process. Blue light systems use a filter on the camera to block out all frequencies but the narrow blue light band that it uses. This allows these systems to be largely unaffected by stray light. We use our blue light systems in very heavy lab lighting without issues. We also have a hand held less accurate white light system that seems relatively impervious to ambient light. However, for that system we are only able to extract the STL and not the raw point cloud. So internal to the system, it is smoothing data over that would otherwise probably not look that great.
The traditional white light structured light systems used exotic bulbs to provide the light source that tend to fade with long periods of time which reduces the contrast for data extraction. The newer systems all use LED sources. Our oldest Blue Light Structured Light system has been running for about 7 years and not had an issue with its LED source.
I find that structured light systems can be very accurate to low accuracy depending on the style and compromises made in the system design. Our high end systems are very accurate (from around 9 microns to 60 microns of measurement uncertainty) and the hand held systems are less so (closer to 500 microns of accuracy even though they will advertise ‘up to 100 microns accuracy’) but very easy to use and manipulate.
Laser Radar / Laser Tracker
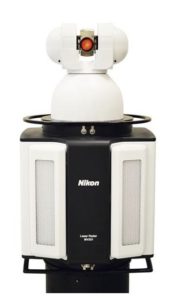
FIGURE 9: Nikon Laser Radar
Since Laser Radar (Non-Contact System) and Laser Trackers (Contact System) have a lot in common, I am including a description of both here in this non-contact measurement system article.
Laser trackers have been around for a while and are used heavily in precisely aligning large equipment or for measuring large parts or parts separated by large distances. They are basically similar to giant (1.5″ spherical diameter) manually operated point probes. They collect one point at a time using an SMR (Spherical Mounted Retroreflector) and have a range of around 120m. The SMR is hand held and the reflector always has to point at the tripod mounted base unit. There needs to be line of sight to the tripod mounted tracker from the SMR. There accuracy is very good and in the low thousandths of an inch generally speaking. If you can limit the use of the rotational encoder in the tracker (by moving the tracker far enough away from the object being measured that it does not have to turn through much of an angle), you obtain the most accurate results.
They do collect point clouds like a fixed CMM but must be human operated like a portable CMM (which they are also considered to be). They can be combined with portable arm based CMMs to gain more flexibility and accuracy when line of sight restrictions come into play. There are various accessories that can replace or augment the SMR to allow for measurement of edges and other features. There are also accessories that simulate a hand held traditional CMM probe for collecting data in hidden areas.
Nikon’s Laser Radar is the best upcoming challenger to this technology. This is technically a touchless data collection system that has a range up to 50m. Both Trackers and Laser Radar are portable and long range devices. Laser radar avoids the requirement of holding an SMR to take data and is programmable. Nikon’s recent marketing efforts are geared toward automotive and inline inspection of vehicles. However, there are a myriad of uses for the technology. It also has a scanning mode that can generate a relatively large point cloud (scanning at 2,000 points per second). The accuracies are very similar to laser trackers. The large hurdle for broad acceptance of this technology is the price. At around $400,000 it is 3x the cost of modern trackers! If the price were half or lower than its current price, it might put a large part of the laser tracker market out of business.
CFS
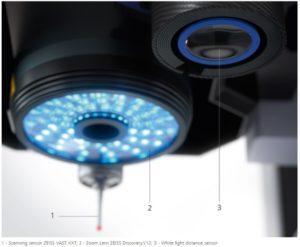
FIGURE 10: CFS Sensor (Item 3 in image)
A con-focal white light distance sensor (CFS) uses a very different way of collecting a point cloud. It does not use a laser or structured light to collect data, but uses rather light frequency (color) instead. It generally consists of an optic in which focused white light is passed through and made to split up into various frequencies and those frequencies are used to judge distance.
When you send white light through an optic the frequencies or colors do not all converge again on the other side of the optic in the same location. This is due to the variation of the index of refraction of different frequencies of light through the optic medium (different colors of light bend differently through optics). The effect of this is to establish a vertical ‘rainbow’. When an object to be measured is placed somewhere in this rainbow, reflected light travels back through the system and is read out. That light may have many frequencies of light that are reflected back through the lens but only one will have focused on the surface of the part and this is easily seen by the system. This frequency is then read out and the absolute distance from the instrument can then be known.
The advantage of such a system lies in its ability to be impervious to the surface specularity (think mirrored or chromed surfaces) or transparency. Other systems such as laser and structured light require a diffuse surface to reflect light for the camera to capture data (some of these systems are better at specular surfaces than others but all of these other systems are affected). So with a CFS sensor we can measure mirror finish articles or even optics without any surface preparation (powders or paints: FOD – foreign object debris).
Our CFS scanner is mounted on our Zeiss multi-sensor vision system and has a very good measurement uncertainty of around 2.4 microns. It is a relatively slow scanner at 2,000 points per second. However since it is mounted on a programmable CMM, it can run overnight to capture larger surfaces with a dense point cloud. One of the interesting things we have done with ours is to capture the surface of a small 1” damaged coin die for a reverse engineering. The data came out fantastic and with high detail. This would have not been possible with laser or structured light due to the precision required and the mirror surface finish.
Summary
No one piece of touchless data equipment is suitable for all applications. Larger service providers have an array of devices available to them to service your projects. They also have a depth of experience with each of these equipment types and use them daily and are thus efficient. We at 3D Engineering Solutions want to be an extension to your internal engineering resources for dimensional data collection and processing. Please allow us an opportunity to quote your next project.
Leave a Reply
Want to join the discussion?Feel free to contribute!